
How to Reap the Benefits of Jobs To Be Done When Improving Recommendation Systems
Imagine this scenario. A parent is struggling to keep their toddler entertained while a kettle has boiled over. They des...
You may be familiar with the following scenario. The person in charge of digital strategy at your company (and this may be you) starts a meeting by waving a giant red flag. Site analytics reveal that conversion rates are plummeting. Data gets tossed around like a hot potato — no one wants their hands on it. A fire drill ensues. Decisions get made, in haste, to address the problem. But, amid the hysteria, there’s only mere speculation about why conversion rates are plummeting.
Your metrics might tell you what happened, but knowing there’s a problem is only half the battle. If you want to know what to do, you need to know why it’s happening. Enter user experience (UX) research that can actually shed light on those red flags you are seeing in your digital performance metrics.
Whether a conversion for your business is someone requesting more information, filling out a registration form, or completing a purchase – you want more of them, not less. To better illustrate my point I’ll use an example from an automotive client that approached AnswerLab because they redesigned their quote request process and it resulted in an unintended outcome. They were getting significantly fewer dealer quote requests. For automotive companies, the number of dealer quote requests is a key conversion metric, so this was a big problem. They looked to the site analytics to figure out what was happening and found that 40% of site visitors were dropping out of the ‘request a dealer quote’ flow on the dealer selection page.
Though the metrics were showing they had a 40% drop out rate, we needed to know why. Were visitors changing their minds about wanting a quote? Was the form too long? Or were visitors trying to avoid providing certain personal details?
We needed to know their mindset, specifically:
To get our answers, AnswerLab conducted a behavioral tracking qualitative survey. These are designed to provide insights into how people navigate through a site, as well as their overall experience. You invite target customers to take the survey, which asks participants to conduct tasks on the site and tracks the unique clicks and paths they take. We can trigger questions when someone leaves a page, and ask for their feedback in comments and open-ended responses to determine the ‘why’ for drop-off. With a behavioral tracking survey, you get quantitative user experience metrics and qualitative insights through comments and open-ends.
The behavioral tracking survey data mirrored what the site analytics revealed, with very comparable drop off rates found at the dealer quote request point.
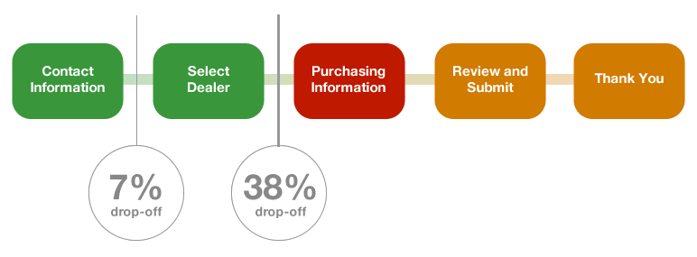
And here’s where the user insights demonstrate their value – digging into the qualitative survey responses revealed what was really happening. There was a small proportion (7%) of visitors who didn’t want to provide personal contact information, and they didn’t realize that the information was not required to move forward. However, the big payoff from the research was the insight into that larger drop (38%) at the point of dealer quote request. The research revealed that many of those visitors thought they had reached the last step in the form submission; visitors were not intentionally abandoning the form. The page gave users what looked like a typical confirmation message too soon in the process. There was no clear next step highlighted in the main content zone of the page. And the “select dealer button” wasn’t readily visible to visitors. Site visitors, under the impression that they had completed the quote request process, were waiting around for a dealer response that was never going to come.
The UX research insights were gold — they gave us a clear understanding of the underlying issue driving the plummeting conversion rates. Armed with this information, we could recommend a roadmap for fixing the issues. In this case, the automotive client increased conversion by making the progress indicator more prominent, by eliminating misleading confirmation messages, and by explaining which personal information was required and which was optional. Imagine how much time and money might have been wasted chasing unexamined hypotheses, developing and designing to address issues that weren’t driving the conversion rate free fall.
This is just one example of how UX research can get to the “why” behind digital performance metrics.